

This article reveals three quick and easy ways to calculate a close approximation of the Bloomberg Adjusted Beta for any publicly traded stock. While many readers will use Barra or Bloomberg, this guide enables you to develop a more intuitive understanding of the most utilized interpretation of Betas in the context of the Capital Asset Pricing Model:
- Degree of nondiversifiable or market risk for a particular stock/share. There are various methodologies and providers of such Betas, which are divided into two main camps: the historical Beta users and the forward looking Beta users, Bloomberg utilizes the former.
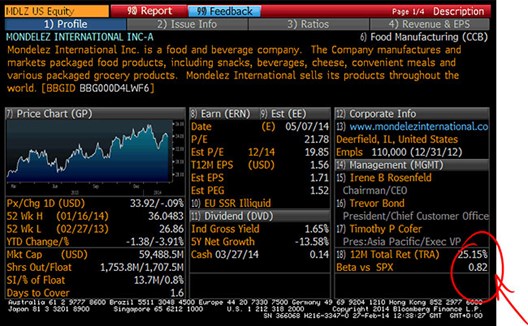
In this guide we will approximate the calculation from the below Bloomberg terminal view for Mondelez International Inc. as of February 27th, 2014. The value of the Beta vs. the Standard and Poor’s index/SPX we will calculate is 0.82 (circled in red below).
Step 1 – Calculating beta from a stock
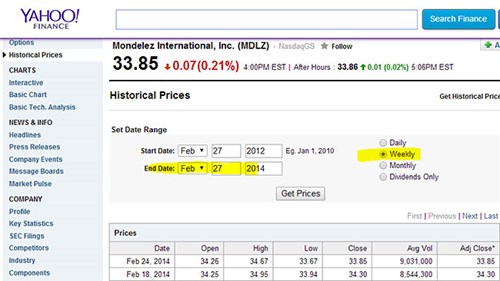
Any reputable share price information source should suffice, we have chosen Yahoo Finance. Obtain and download weekly closing stock prices (adjusted for dividends and splits) for a period of two years (should finish at same date as Bloomberg’s Beta calculation, in this case February 27th, 2014)
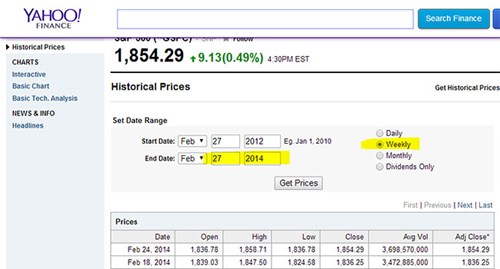
Obtain and download the weekly closing price for the S&P 500 index for the same period and frequency.
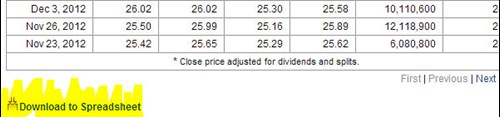
Tip – If you use Yahoo Finance, the information can be easily downloaded to Excel
Step 2 – Using adjusted beta formula
When using Yahoo Finance the initial output into Excel looks as follows:
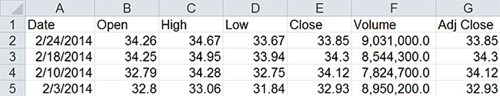
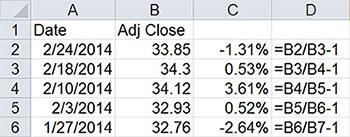
We will only need the “Date” and the “Adj Close” columns; hence we erased columns B to F. Calculate simple weekly returns of the stock by dividing the adjusted closing price in each week by the previous adjusted weekly closing, minus 1.
On the same worksheet repeat the process for the S&P/SPX closing values.
Step 3 – Calculating the beta
First, we will calculate the raw statistical data or Bloomberg’s “Raw” Beta. This “Raw” Beta is before Bloomberg’s proprietary adjustment to “move” each particular company’s Beta toward the market, i.e. towards a value of 1. We will illustrate three methodologies to calculate the “Raw” Beta.
-
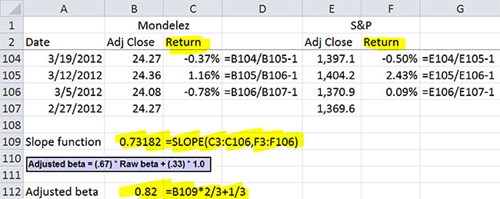
Method 1 – How to calculate beta in Excel using slope
On the same worksheet as the data (data must be on the same page as the formula), type =slope(x data, y data) The X data is the return on the stock, while the Y data is the return on the index Afterwards, convert “Raw” Beta into Bloomberg’s Adjusted Beta by applying Bloomberg’s proprietary adjustment as follows:
-
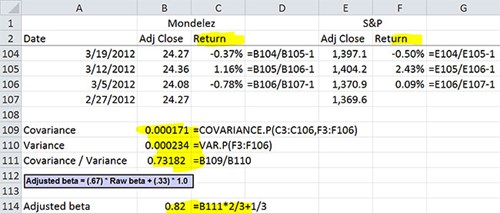
Method 2 – Calculating covariance in Excel
On the same worksheet as the data (data must be on the same page as the formula), type =covariance.p(array 1, array 2) The array 1 data is the return on the stock, while the array 2 data is the return on the index On the same worksheet as the data (data must be on same page as formula), type =var.p(range) The range is the return on the index Divide covariance by variance, and thereafter, convert “Raw” Beta into Bloomberg’s Adjusted Beta by applying Bloomberg’s proprietary equation as follows (same as method 1 ):
-
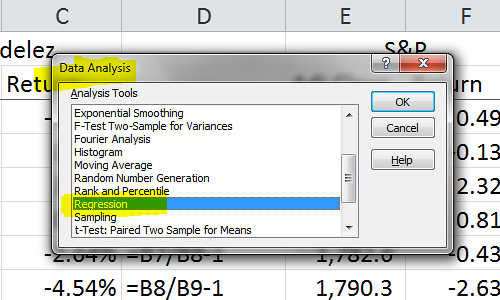
Method 3 – How to calculate beta in Excel using regression
Go to the Data tab Select Data Analysis – If you are missing the Analysis section you must enable the “Analysis ToolPak”, this can be found under File>Options>AddIns>Choose Excel AddIns>Go>Tick the appropriate checkbox>OK Select Regression option
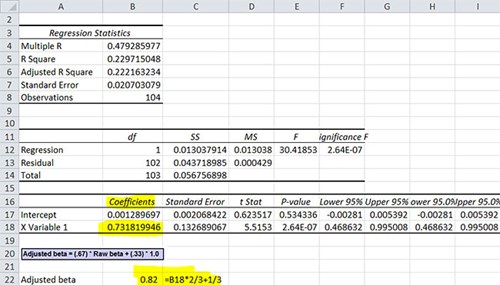
You have the option to show the output of the regression on a separate worksheet or on the same worksheet at the raw data. Input Y Range is the return on the stock, while Input X Range is the return on the index.

The value that indicates the “Raw” Data is the X Variable 1 Coefficient. Finally, convert “Raw” Beta into Bloomberg’s Adjusted Beta by applying Bloomberg’s proprietary equation (same as Method 1)
Which one should I use?
There is no universally best method. Some may argue that the slope function is the quickest, but ultimately use what you are comfortable with. With the variety of statistical backgrounds the three options give you some flexibility in choosing a method that works for you. If you have any questions about the above please leave a comment and we will do our best to answer them.
Please do not hesitate to contact us, if you are having trouble viewing or accessing this article.
Copyright© 2016 AMT Training